The 2022 statistical reports mark the 15th set of staff and student demographics published by Advance HE (and previously the Equality Challenge Unit). Over the years, these reports have grown substantially, and there have been continuous developments in the data submitted to the HESA staff and student records, that have made the overall product a very different beast to its original format in 2008.
What have we learned over the past decade and a half?
While we’ve prepared fifteen reports covering data from the academic year of 2003/04 to 2020/21, some of the changes to which data were available and when, limited the analysis over time presented below.
Earlier today, we published the Staff and Students Statistical Reports 2022, along with a full set of infographics, for Advance HE members
Join our webinar: Equality in Higher Education: insights from the 2020-21 staff and student records, 10:00-11:00, 22 November 22 where the author of this blog and lead for the reports, Amanda Aldercotte, Head of Knowledge and Research, will discuss how these insights can be translated into institutional aims and areas for additional research.
Nonetheless, there were three main things that we could see when we took a step back and looked at the data over time:
- There has been progress in a number of areas, particularly in the areas of ethnicity and sex.
- This progress has been incremental, with gradual improvements year-on-year.
- The rate of progress varies by protected characteristics and the distinct identities that exist within these.
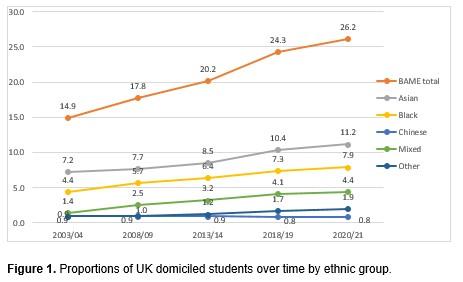
For example, the overall representation of individuals identifying as Black, Asian and minority ethnic has increased from:
- 14.9% of all UK domiciled students in 2003/04 to 26.2% in 2020/21.
- 8.6% of all staff in 2003/04 to 16.3% of all staff in 2020/21.
With regards to students, representation has improved at a fairly consistent rate of roughly 0.4-0.8 percentage points per year since 2003/04 (see Figure 1). However, as noted in point 3 above, progress was experienced differently by different ethnic groups – specifically, progress has been driven by improved representation of students from Asian, Black and Mixed ethnic backgrounds, while the proportions of students from Chinese and Other ethnic backgrounds has stayed relatively the same.
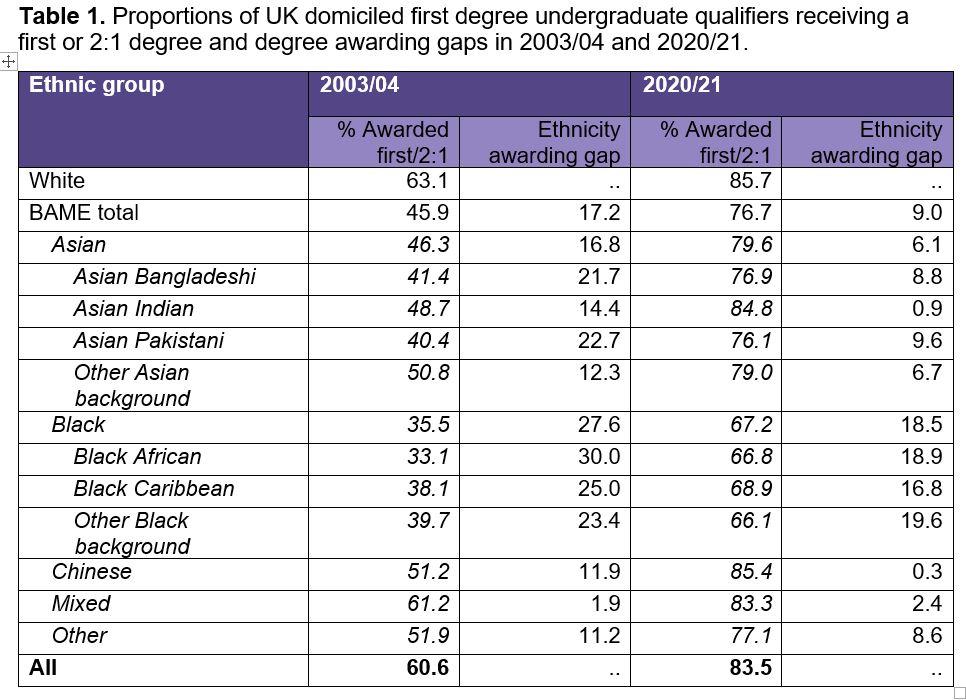
Beyond representation, these learning points also apply to the ethnicity degree awarding gap; since 2003/04 the awarding gap between UK domiciled White and Black, Asian and minority ethnic first degree undergraduate students has decreased from 17.2 percentage points to 9.0 percentage points (see Table 1 below). Although the gap closed steadily across this timeframe, there were three points in which the gap narrowed significantly year-on-year (between 2011/12 and 2012/13, 2012/13 and 2013/14, and 2018/19 and 2019/20, see table 3.15 of the student report for more details). But, what is apparent in Table 1 below is that this narrowing was not consistent across the gaps between individual ethnic groups and White students. The biggest strides in narrowing the awarding gap have been amongst students from Asian, Black, and Chinese backgrounds, while there has been less improvement amongst students from Other ethnic backgrounds.
Amongst Black, Asian and minority ethnic staff, the rate of improvement in their representation varied, starting slowly with increases of 0.2-0.4 percentage points per year, then jumping to rates of 0.6-1.0 percentage points per year since 2015/16. Although these data cannot tell us exactly what underpins the improved rates of progress seen in recent years, there are a number of targeted initiatives and policies, such as the Race Equality Charter, and general improvements in the pipeline of Black, Asian and minority ethnic students, that are likely contributors.
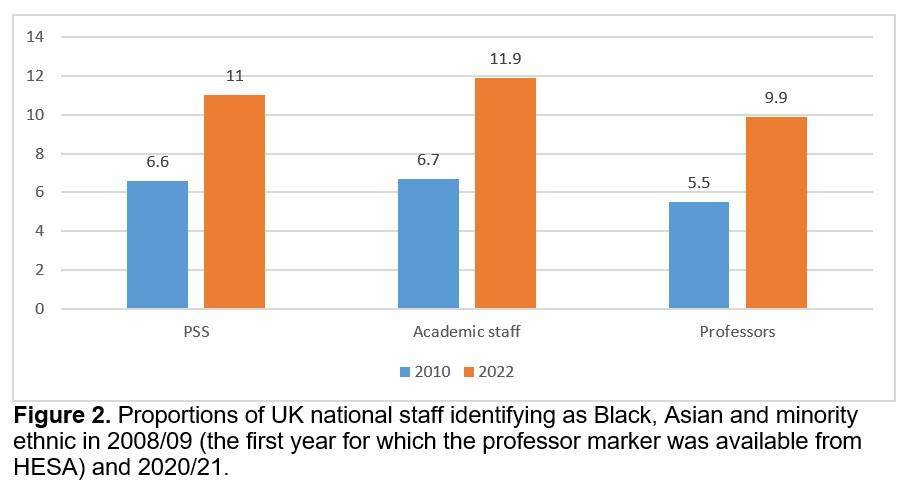
This brings us to the third take-home message however, as the general improvements noted in representation of Black, Asian and minority ethnic staff was primarily amongst UK nationals, increasing from 5.4% of all staff in 2003/04 to 11.4% of all staff in 2020/21 (compared with the increase in non-UK nationals from 31.6% in 2003/04 to 33.6% in 2020/21). But, rather encouragingly, the improvements amongst UK nationals at least tended to be consistent across both professional and support as well as academic staff, and amongst academic professors (see Figure 2).
With regards to sex, the story we see over the last decade and a half is similarly nuanced. On the surface, there appears to have been little change in the representation of female students (e.g. 57.3% and 57.2% of all students in 2003/04 and 2020/21, respectively). Even when we consider students enrolled in SET (science, engineering and technology) subjects separately, we still do not see much change in general representation. Instead, our examination had to dig deeper and think about gender inequalities in a more nuanced way, looking at differences in how male and female students approach their studies and to which subjects they are specifically drawn (or steered) towards. For example, over time the proportion of female students studying full-time increased from 61.5% in 2008/09 to 77.7% in 2020/21, as did representation of female students in subjects such as computing (from 18.7% to 21.1% in 2008/09 and 2020/21, respectively) and engineering and technology (from 16.1% to 20.2% in 2008/09 and 2020/21, respectively).
The proportion of female academic staff increasing slowly from 40.0% in 2003/04 to 47.0% in 2020/21. This improvement corresponded with similar progress in the representation of female academics amongst professors (e.g. in 2008/09, 18.7% of professors were female compared with 28.5% of professors in 2020/21) and the median pay gap between female and male academic staff (dropping from 13.6 percentage points in 2008/09 to 8.5 percentage points in 2020/21).
So what about the reports has changed exactly?
I’m so glad that you asked – in short, almost everything. As you can see from the analysis above, the availability of specific data has varied over time. And while the intended uses of the reports have remained the same – they are prepared to provide evidence of current equality issues at a national level, inform policy development and provide national benchmarks – the presentation of the data, the amount of data covered, and the definitions of the data fields have all undergone transformations, particularly over the last three academic years.
For example, and perhaps the most interesting of the changes, has been to the protected characteristics covered in the HESA student records. Not only has this coverage expanded to include information on gender reassignment (referred to as trans status in the current report), sexual orientation, and religion and belief, but also the quality and integrity of the data collected on these identity characteristics has improved substantially as HESA made returns on these mandatory for providers between 2017/18 and 2020/21. Moreover, the recent integration of HE-in-FE providers into the HESA student records has meant that this database covers more students in UK higher education than it ever has before.
Coverage of students’ religion and belief jumped from 80.2% in the 2016/17 to 99.4% of UK institutions in 2017/18. In the current report, we see a similar jump in the representativeness of students’ trans status and sexual orientation.
In 2019/20, only 143 out of 170 providers (84.1%) returned data on students’ trans status, representing data from 1,879,715 students in UK higher education. Coverage was similar for students’ sexual orientation in 2019/20, with 150 out of 170 providers returning data (88.2%) from 2,127,955 students.
In contrast, after making returns mandatory in 2020/21, 252 providers (out of 258, 97.7%) returned data on students’ trans status and sexual orientation, expanding the number of students represented to 2,632,620 and 2,702,335, respectively.
That’s great. But why is it important?
These improvements in the representativeness of the student records mean that we can interpret the data, and any changes in it year-on-year, in a more reliable way. When the coverage was incomplete, any increases or improvements could not be deciphered – was it actual change, or was it just that different institutions returned data that year?
This change in the quality and coverage is important, not just because it allows us to benchmark these protected characteristics and interpret any changes more accurately, but also because it enables us to consider how these characteristics intersect with other identity characteristics. For example, for the first time, the 2022 student report presents an intersectional analysis of students’ religion and belief data by age, disability status, ethnicity and sex (in Tables 5.15 through 5.21).
You may have noticed that I’ve only presented data on students here – that’s because returns on staff’s self-reported religion and belief, trans status and sexual orientation remains voluntary for providers. Which brings us on to our next point. While we’ve seen a number of improvements in the coverage of the student record, the quality of the data collected on staff has become less reliable to interpret over time, particularly amongst staff working in professional and support roles. Specifically, in 2019/20, HESA made returns on professional and support staff voluntary for HE providers in England and Northern Ireland). This meant that the overall population of professional and support staff fell from 222,885 in 2018/19 to 196,205 in 2019/20 and finally to 191,435 in 2020/21, essentially hiding the growth in this population that we had seen over time (as shown in Table 0.2 of the staff report). Additional analysis (described in more detail in the ‘About the data’ section of the staff report) shows that this change has had a detrimental impact on our interpretation of the equality data presented for this population; there were a number of professional and support staff populations that were less likely to have their data returned in 2020/21, including those:
- From Asian and Black ethnic backgrounds
- Aged 41 to 50 years’ and 51 to 60 years’ old
- Who disclosed as disabled
- Who indicated that they were female.
While we have partitioned academic and non-academic staff in many of the tables presented in the staff report, the changes to the professional and support staff returns has a trickle-down effect on the proportions and percentages reported at the all staff level. We will continue to report on this population and monitor changes to its coverage, as you can see that this simple shift in making reporting voluntary has the potential to severely limit the documentation and interpretation of any evidence of progress or improvement.
What’s next?
Well, one area for development that is currently underway is updating the definition of the sex field required by HESA for both staff and students. The 2022 reports mark the first year that Advance HE has referred to this field as ‘sex’ instead of ‘gender’ to align more closely with our guidance on monitoring protected characteristics, and to anticipate changes to the definition of the response option ‘Other’ that HESA will be applying for the 2021/22 submissions. Specifically, HESA is updating the definition of other (as a response option) to include staff and students from a country where a third sex is legally recognised, instead of it applying to those whose sex aligns with terms such as intersex, androgyne, intergender, ambigender, gender fluid, polygender and gender queer. This update removes cross-over of a gender-defined response option into a sex-based question.
Notably, the proportion of students selecting ‘Other’ has doubled since 2018/19, from 0.1% of the student population to 0.2% to in 2020/21. Although considerably smaller in numbers, a similar increase in representation of those selecting ‘Other’ was seen in the staff population, jumping from 0.0% in 2018/19 to 0.2% in 2020/21.
To reflect the change in our label to sex, and to better represent the growing populations of staff and students who self-identify as other in the HESA records, we have included a new series of data tables in our downloadable Excel file. Where possible, we have duplicated our current tables representing the number of staff and students who selected 'Female' and 'Male' to also include the staff and students identifying as 'Other'.
We have duplicated the tables, rather than replaced, in order to maintain the year-on-year comparability of the percentages for benchmarking. Although the staff and students represented in these new tables have self-identified as ‘Other’ using the gender-based definition, we considered it important to include these data in the 2022 reports in order to track how this upcoming change impacts the data collected.
Concluding remarks
Despite these changes, this anthology of Advance HE’s staff and student reports provides a history of equality demographics over the last decade and a half. Without agenda, these reports show plainly where we have progressed and made important improvements – both in the quality of data collected and areas of inequality – and where we need to turn our attention to over the coming years.
Join our webinar: Equality in Higher Education: insights from the 2020-21 staff and student records, 10:00-11:00, 22 November 22 where the author of this blog and lead for the reports, Amanda Aldercotte, Head of Knowledge and Research, will discuss how these insights can be translated into institutional aims and areas for additional research.